Energy consumption tells you how much energy your operation uses. But that number alone does not provide a complete story.
What did that energy cost when it was consumed? When did site demand peak? How did energy use change throughout the day? And where could operations be adjusted to optimize energy costs?
Utility rates, energy consumption, and energy management are closely connected. Bringing them together creates a complete picture of how energy is being used across an operation.
The opportunity is not simply having more energy data. It is having the right context to understand that data, the controls to act on it, and the visibility to measure what happens next.
Looking Beyond Energy Consumption
Knowing your total energy consumption is straightforward.
Understanding what is driving it, what it may be costing you, and where there are opportunities to manage it requires additional context.
You need answers to questions like:
- When does our site experience its highest demand?
- How does energy use change throughout the day, week, or month?
- What utility rates are in effect when that energy is being consumed?
- When are higher-cost time-of-use periods occurring?
- What is an individual charging session costing?
- Where could energy use be adjusted around site capacity or operational needs?
Looking at consumption, utility rates, and demand separately only provides part of the picture.
Connecting them makes it easier to understand not only how energy is being used, but what that usage means for the operation.
Bringing Cost, Consumption, and Control Together
InControl™ brings utility rates, energy data, and Smart Charging controls together, giving you the context to understand your energy use and the best tools to manage it.
Connect energy use to cost.
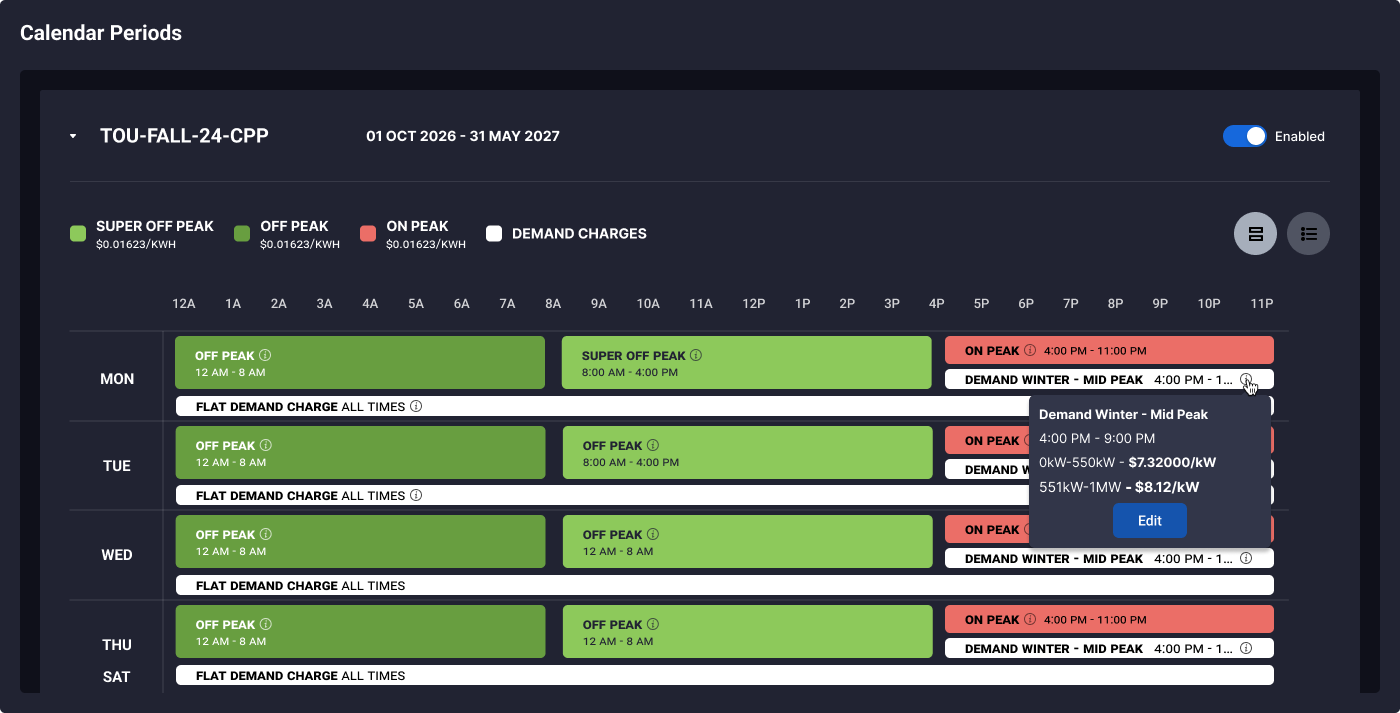
By adding your site’s utility rate structure, including energy rates, time-of-use periods, and demand charges, InControl can translate charging activity into estimated cost insights. Enabling you to understand estimated energy and demand costs at the site level while adding cost context to individual charging sessions and activity across specific assets or vehicles.
Understand when and how demand occurs.
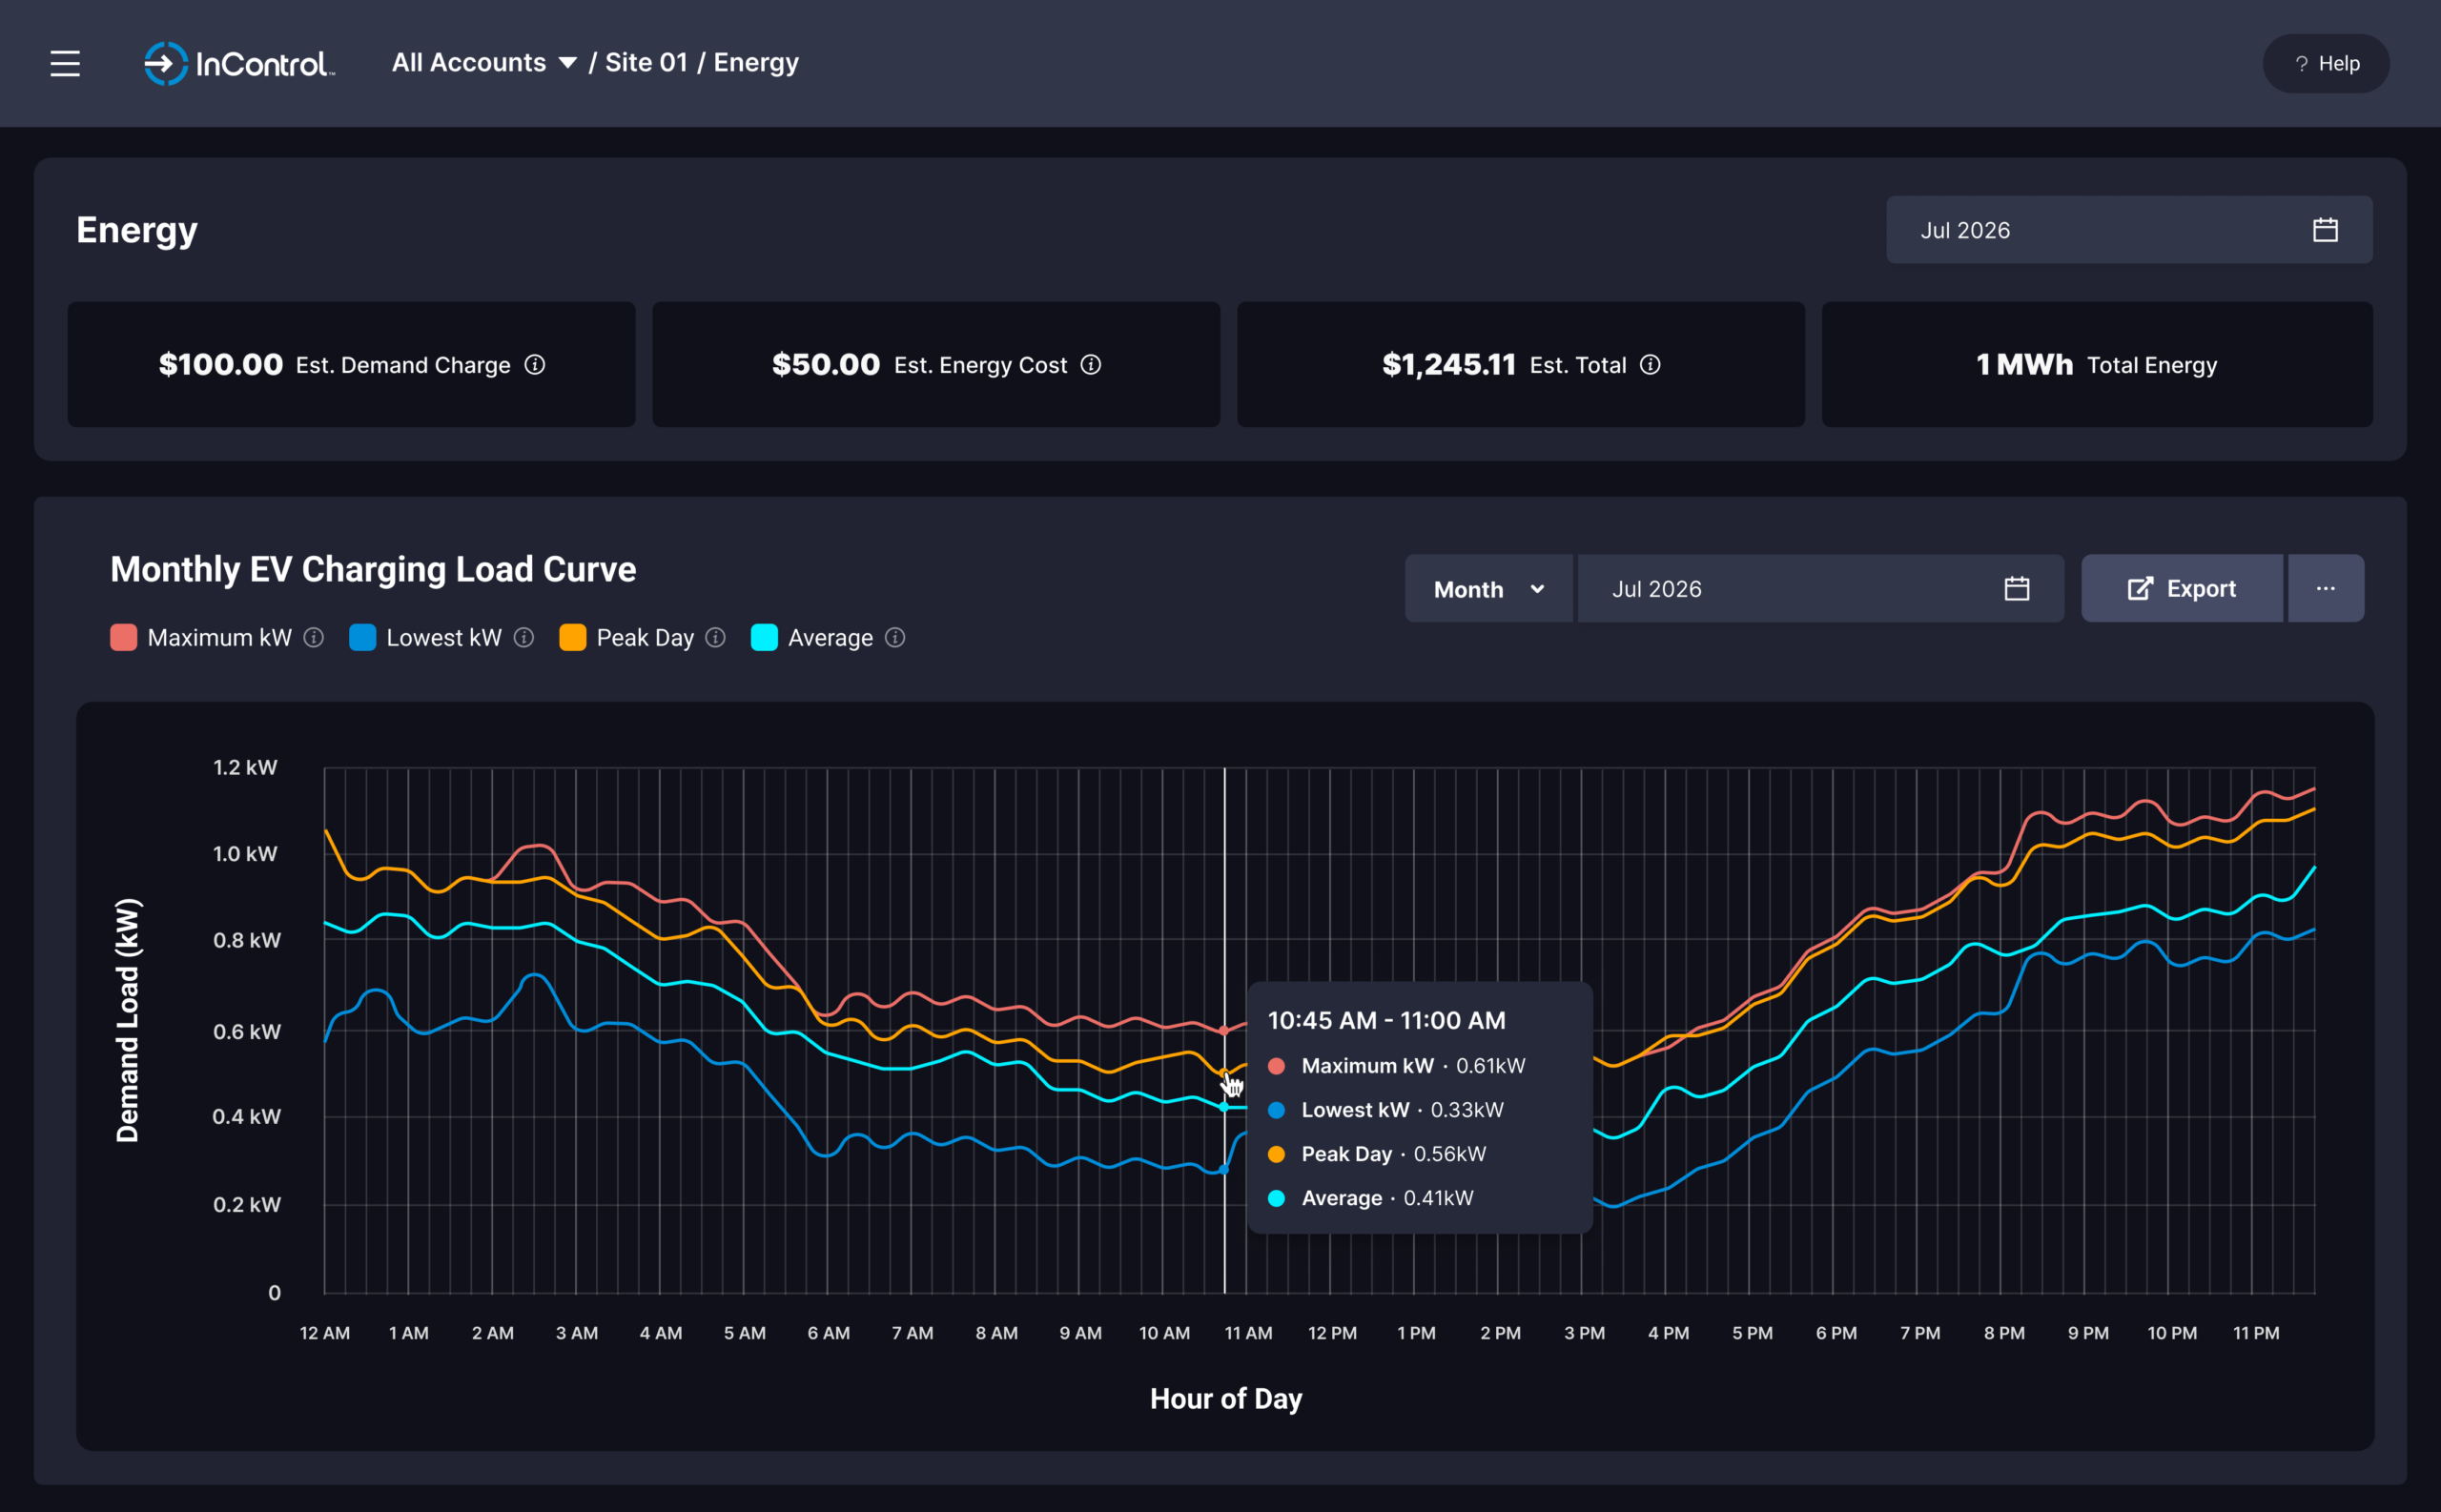
The Energy Page brings consumption and estimated costs into one view. Monthly and weekly load curves help teams identify recurring peaks, understand differences throughout the day or week, and see how the site’s energy profile changes over time.
Turn patterns into action.
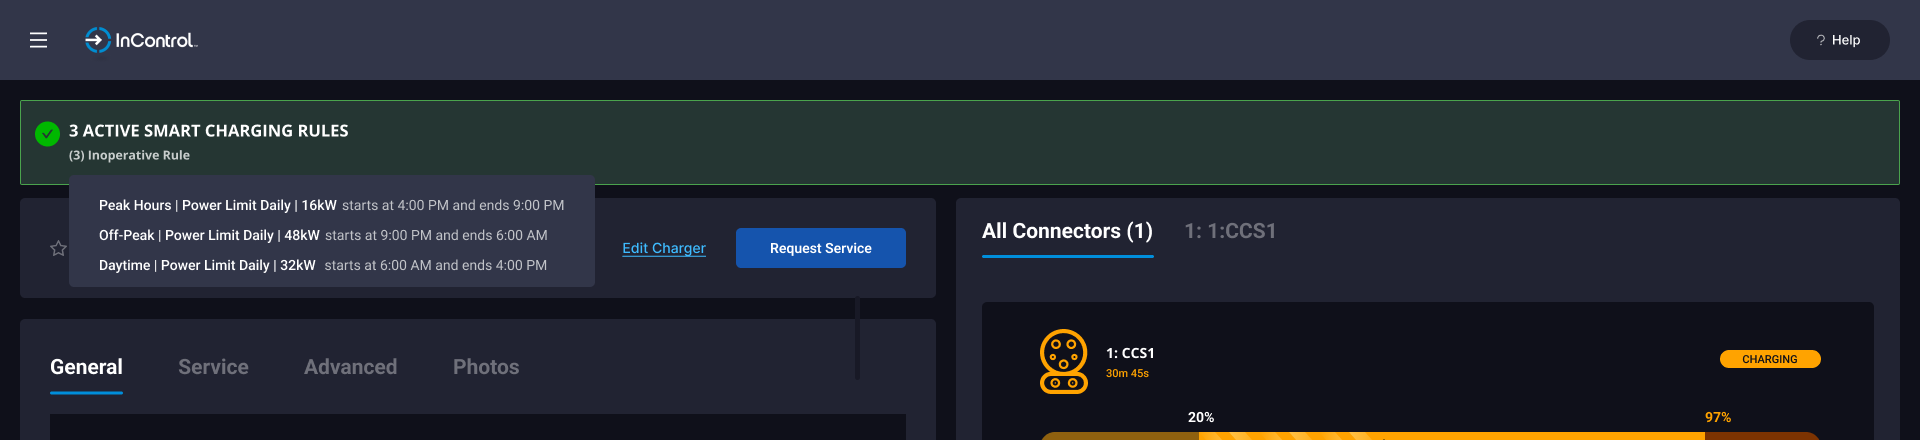
When the data reveals an opportunity to manage energy differently, Power Limit rules provide the tools to act. Power limits can help manage peak demand, distribute available capacity, shift charging into different periods, and align energy use with site and operational requirements.
With InControl™, your teams can:
- Add utility rates, time-of-use schedules, and demand charges specific to a site
- Visualize energy consumption and demand over time
- Identify peak demand periods and understand estimated costs
- Implement power limits to manage available site capacity
- Schedule energy usage around operational needs and utility rate periods
- Monitor energy patterns and continue refining your approach
Together, these capabilities help teams answer a connected set of questions:
What does our energy cost? When and how are we using it? Where is demand highest? What can we change? And what happened when we did?
Energy Management in Action
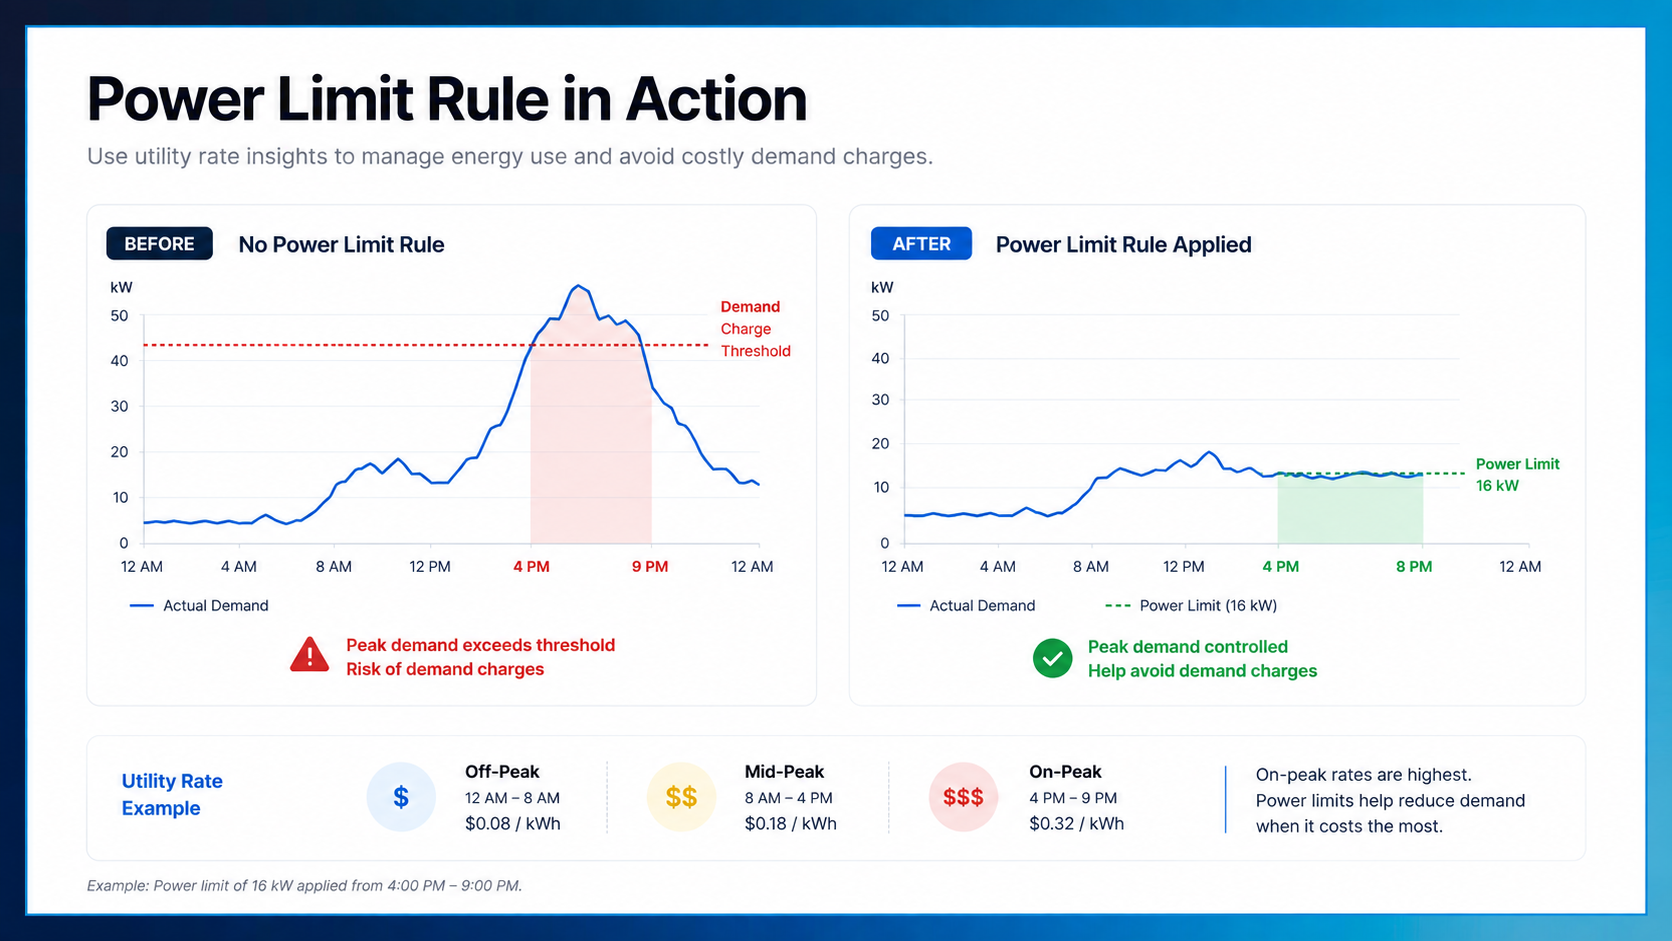
With Smart Charging, Power Limit rules help manage how much power is available for charging based on your site’s capacity, energy costs, and operational needs.
For example, your energy data may show high demand during a more expensive utility rate period.
In this example, a Power Limit rule sets a maximum of sixteen kilowatts between four P.M. and nine P.M.
During that period, InControl manages charging within the defined power limit.
This can help manage peak demand, make better use of available site capacity, and provide greater control over energy costs, while continuing to support your operational needs.
See Utility Rates, Energy, and Smart Charging working together in InControl™ → Watch the Demo